Trends From the Top 100 Sustainable Innovators

Sustainability is a global imperative, with companies worldwide striving to demonstrate their contributions. The 2030 Agenda for Sustainable Development, adopted by all UN member states, outlines 17 Sustainable Development Goals (SDGs) as a blueprint for a prosperous future. Innovation plays a key role, and to enable innovators to assess and derive actionable insights from the sustainable technology development, we have integrated the SDGs into our Intellectual Property analytics business intelligence solution, LexisNexis® PatentSight®.
In 2021, we mapped the UN SDG targets and indicators to the global patent database and integrated them into the innovation analytics platform PatentSight offering an objective sustainability analysis based on precise and publicly disclosed technologies. This approach provides clear insights into current investments and future potential, enhancing transparency in sustainable innovation efforts.
This year, we took it a step further and used the SDG mapping in PatentSight to publish a report, “Exploring the Global Sustainable Innovation Landscape: The Top 100 Companies and Beyond”. The report assesses the global patent landscape and reveals the Top 100 sustainable innovators in the world—ranked based on the quality of sustainability-related inventions they own. Using the objective lens of patents, you will gain new insights into regional and market dynamics shaping sustainable intellectual property strategies, industry deep dives, and in-depth analysis on specific SDGs along with visualizations illustrating the SDG-relevant patent landscape. It also shows how corporations and governmental bodies can leverage patent analytics to accelerate sustainable innovation.
The LexisNexis approach to measuring sustainable innovation
There are hundreds of thousands of patents held by companies and millions of patent applications. A manual review of all of this data to identify individual sustainability or insights into the sustainability activities of whole industries is a near-impossible task. Our patent experts have developed a solution by mapping 13 of the 17 SDGs (SDGs 8, 10, 16 and 17 are not technology-driven and are therefore not mappable to patents) to the PatentSight database of high-quality patent data from more than 95 patent authorities worldwide, analyzing over 147 million global patent documents behind 14 million patent families. The experts analyzed all UN SDG documentation on 13 goals, the targets related to them and their unique indicators that track progress. They then assessed how the UN describes the goals, how it measures them and what it suggests as actions for meeting them.
The “Exploring the Global Sustainable Innovation Landscape” ranking shows the Top 100 corporate patent owners globally according to the absolute strength of their SDG related patent portfolios measured by the Patent Asset Index. The Patent Asset Index assesses the number of patents in a particular technology field, as well as patent quality as measured by the Technology Relevance—a patent’s impact on further inventions—and the Market Coverage—the economic size of jurisdictions in which the patent is protected.
Several key findings on the Top 100 sustainable innovators include:
- 75% of the Top 100 ranking of global corporate patent portfolio owners stated in their annual reports that the UN SDGs were relevant to their business strategy and objectives.
- The Top 100 sustainable leaders, ranked by the absolute strength of their SDG-related patent portfolios, account for 27% of the entire global database (over 147 million global patent documents behind 14 million patent families).
- The regions with the most representation on the Top 100 list are the United States (33 companies), Japan (18 companies), China (17 companies), Germany (9 companies), and Korea (7 companies)
An analysis of trends from the Top 100 sustainable innovators
A thorough analysis of the patent insights derived from the Top 100 unveils trends in contributions towards the attainment of the SDGs as well as the supporting technologies. The chart below shows the share of the top SDGs by Patent Asset Index of the Top 100.
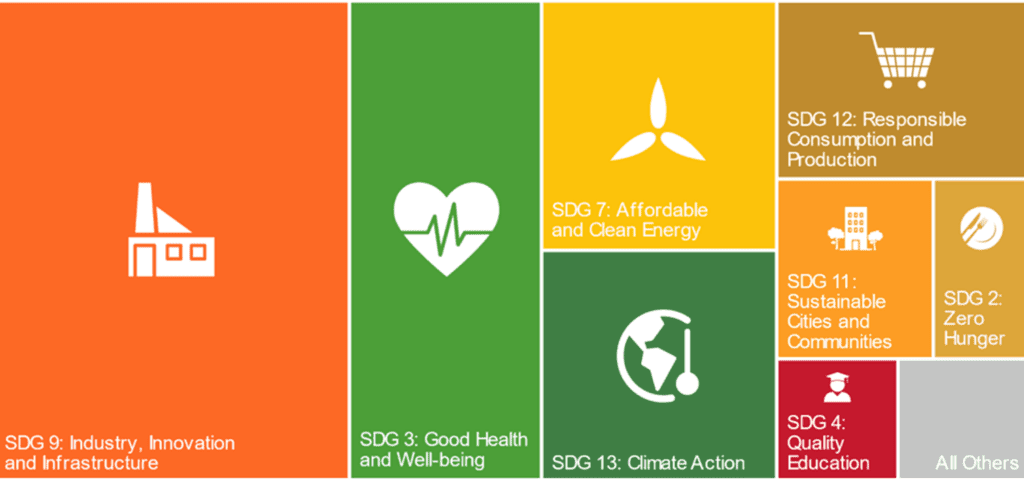
Figure 1: The share of the top SDGs by Patent Asset Index of the Top 100. Source: LexisNexis Report “Exploring the Global Sustainable Innovation Landscape: The Top 100 Companies and Beyond
In the Top 100 sustainable innovators there are three SDGs that dominate in the quantity and quality of patents:
- SDG 9: Industry, Innovation and Infrastructure with Samsung (ranked number 1 of the Top 100 sustainable innovators), Toyota Motor (3), and LG Chem (5) being the most influential in this area.
- SDG 3: Good Health and Well-being with companies Johnson & Johnson (2), Roche (9), and Samsung leading the pack.
- SDG 7: Affordable and Clean Energy with Toyota Motor (3), State Grid (8), and General Electric (7) contributing the most to this goal.
We take a closer look at two of these goals—SDG 3: Good Health and Well-being, and SDG 7: Affordable and Clean Energy—to get a view into what the underlying technologies mapped to those goals are, which of those technologies are strongest based on their Patent Asset Index, and the companies with the strongest SDG Patent Asset Index for those technologies.
SDG 3: Good Health and Well-being Top 100 sustainable innovators
SDG 3 is defined as a goal to “ensure healthy lives and promote well-being for all at all ages.” The SDG targets in this goal range from reducing maternal mortality to preventing and treating substance abuse to achieving universal health coverage, just to name a few. The United Nations reports that “great strides have been made in improving people’s health in recent years. 146 out of 200 countries or areas have already met or are on track to meet the SDG target on under-5 mortality, and effective HIV treatment has cut global AIDS-related deaths by 52 percent since 2010”. The top 3 companies contributing to this goal by the strength of their patent portfolio are Johnson & Johnson, Roche, and Samsung.
The chart below shows the Patent Asset Index of the technology categories present in SDG 3 as represented by the Top 100 leaders in sustainable innovators. We see that the strongest categories of technologies are in Digital Health (Olympus, 81), Cancer (Bristol-Myers Squibb, 25), and Chronic Respiratory Disease (Pfizer, 61).
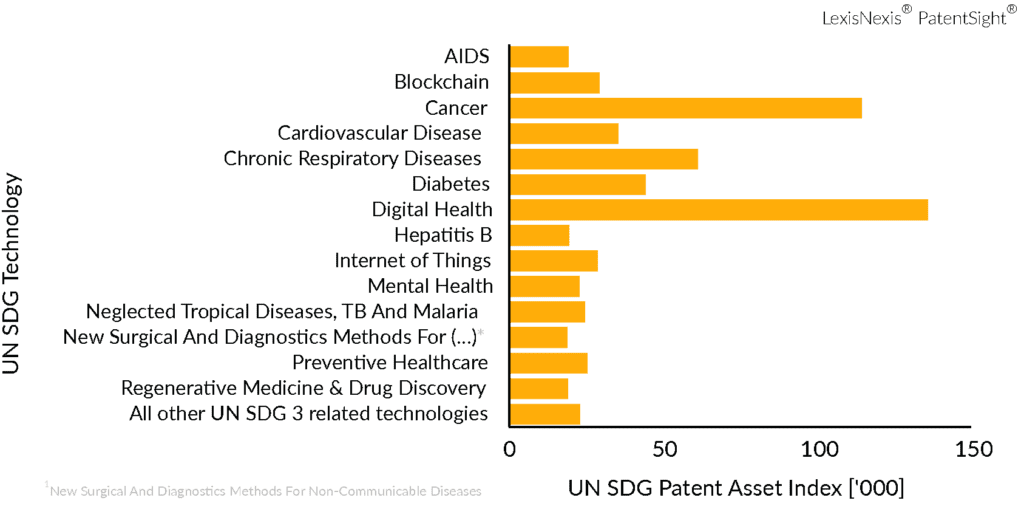
Figure 2: The Patent Asset Index of the technology categories represented by the Top 100 with SDG 03. Source: LexisNexis Report “Exploring the Global Sustainable Innovation Landscape: The Top 100 Companies and Beyond
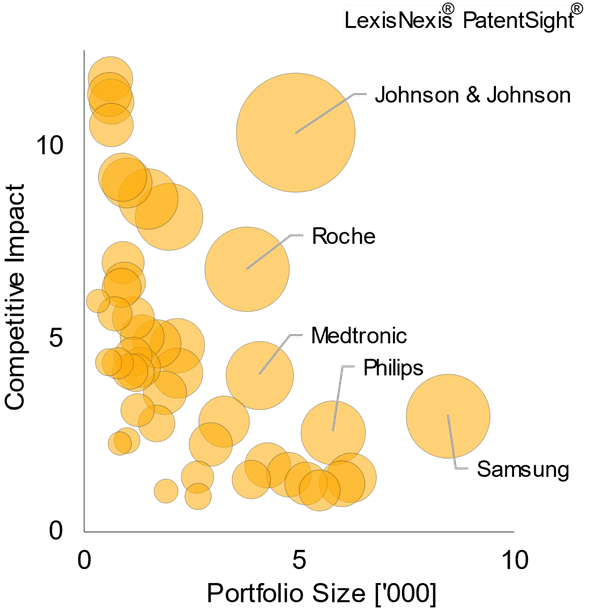
The chart below shows Quality vs Quantity for the Top 100 sustainable innovators within SDG 3: Good Health and Well-being as a focus goal. We see the general behavior is an exponential fall-off of the Competitive Impact as the Portfolio Size increases. But there are also five companies which beat the general trend—Johnson & Johnson, Roche, Medtronic (10), Philips (22), and Samsung.
Figure 3: The Competitive Impact vs Portfolio Size of the Top 100 global leaders with SDG 03 as a focus goal . Source: LexisNexis Report “Exploring the Global Sustainable Innovation Landscape: The Top 100 Companies and Beyond
SDG 7: Affordable and Clean Energy Top 100 sustainable innovators
SDG 7: Affordable and Clean Energy is defined to “ensure access to affordable, reliable, sustainable, and modern energy for all.” Its targets include increasing the global percentage of renewable energy, doubling the improvement in energy efficiency, and expanding and upgrading energy services for developing countries, all by 2030. The United Nations reports that the “latest data suggests that the world continues to advance towards sustainable energy targets. Nevertheless, the current pace of progress is insufficient to achieve Goal 7 by 2030” and “huge disparities in access to modern sustainable energy persist.” The top 3 companies contributing to this goal by the strength of their patent portfolio are Toyota Motor, State Grid, and General Electric.
The chart below shows the Patent Asset Index of the technology categories present in SDG 7, as represented by the Top 100 sustainable innovators. There are quite a few strong categories, including Electric Vehicles (BYD, 98), Hybrid Vehicles (Toyota Motor), Energy Efficiency (OPPO, 96), and Blockchain (Ant Group, 50). The chart shows that almost all companies follow the general trend of a decreasing average quality with an increasing Portfolio Size.
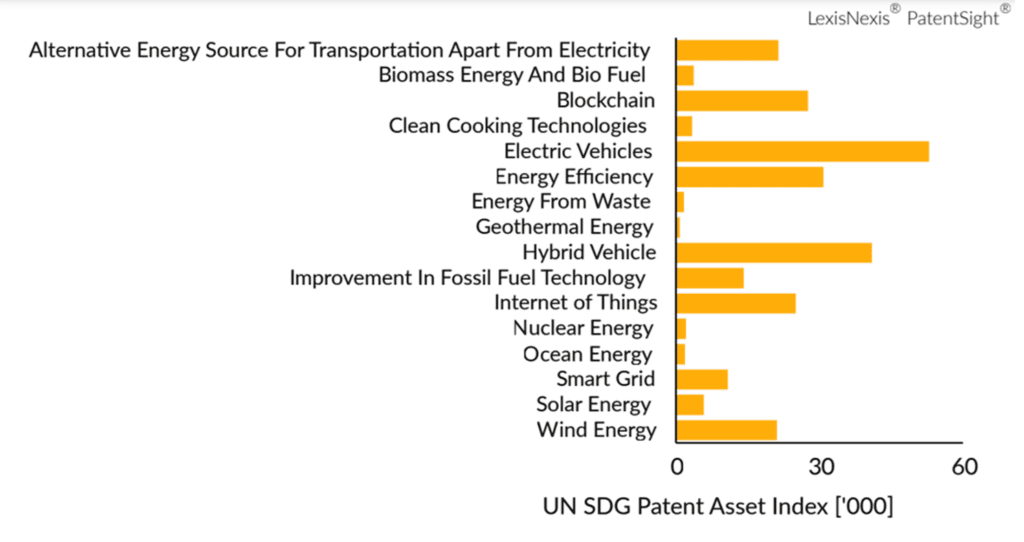
Figure 4: The Patent Asset Index of the technology categories represented by the Top 100 with SDG 07. Source: LexisNexis Report “Exploring the Global Sustainable Innovation Landscape: The Top 100 Companies and Beyond
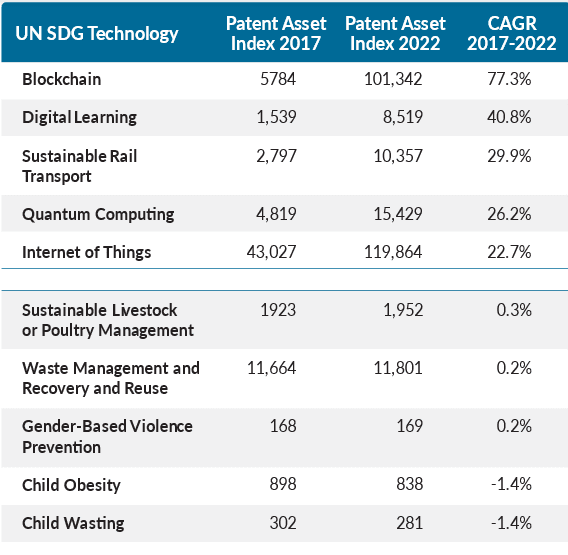
Figure 5: The top 5 and bottom 5 SDG-relevant technologies by their Patent Asset Index. Source: LexisNexis Report “Exploring the Global Sustainable Innovation Landscape: The Top 100 Companies and Beyond
Why read this report?
By uncovering the close correlation between the strength of innovation, as reflected in patent data, and the ability to solve some of today’s most pressing global challenges, this report offers a new, objective way of comparing the contributions of the global corporate sector towards saving the planet. The resulting insights for the Top 100 sustainable innovators are essential reading not only for patent experts but for all key decision makers at companies, including strategic leaders, R&D managers, competitive insights functions, and M&A decision makers. Get the report now.
Unveiling the Top Contributors to the Global Sustainability Agenda
Be at the forefront of sustainability progress. Download our game-changing IP report for a comprehensive view of the world’s top contributors to the UN Sustainable Development Goals.

