How Net Zero Energy Research Translates Into Real-World Applications

In a recent webinar, we discussed our analysis of current and projected worldwide innovation and investment trends spurred by the United Nations–endorsed “net zero” mandate to zero out greenhouse gas emissions by 2050. Net zero will be a significant driver of both government policy and corporate investment in the decades to come, which makes understanding these issues crucial for leaders and planners across the many related industries.
What is net zero?
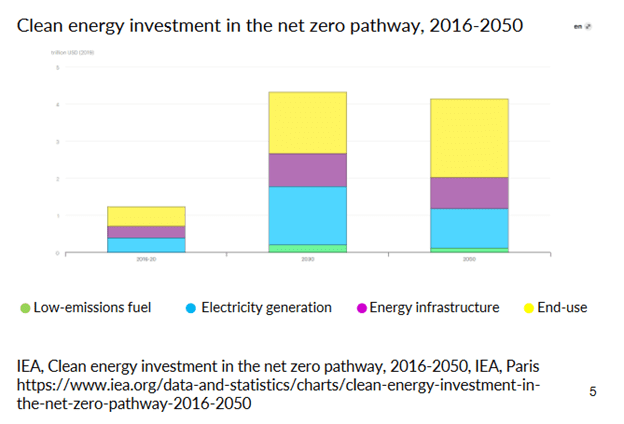
Net zero is the policy adopted by the United Nations aimed at achieving a net-zero state of greenhouse gas emissions globally by 2050. It is one important aspect of the United Nations Sustainable Development Goal Program (UN SDG), which highlights 17 important areas of global well-being. Achieving net zero by 2050 entails enormous scientific and technical developments, which in turn require funding on a massive scale. By 2030, annual global spending on net zero research and technology will reach $5 trillion, about triple the current level, and continue at that rate through 2050.
Net-zero-driven investment and innovation: a global view
This report looks at the current state of net zero investment and innovation. What are the funding trends within the relevant scientific fields? Which countries are leading the advance in terms of new patents and research outcomes? What can be projected in the future as we approach 2050? These questions are relevant not just to governmental bodies but corporate, educational, and funding organizations, which all play important roles.
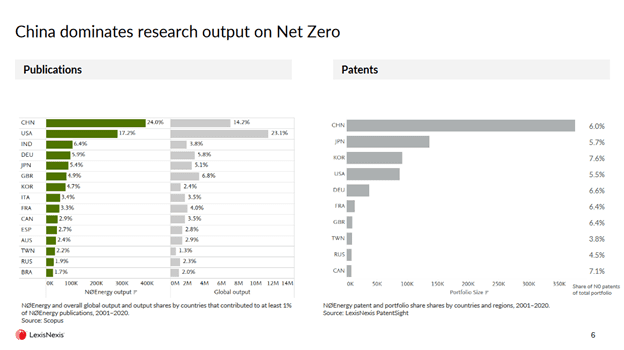
The two main instruments this report employs to measure relative net zero scientific progress and investment between leading nations and relative scientific fields are the numbers and quality of relevant new research publication and patents. On a purely numerical basis, China is the leader in both publications and patents, though the story becomes more complicated when quality/impact measurements are brought to bear on the analysis.
In terms of net zero research publications (primarily papers published in academic scientific journals), China leads by far, with 24% of the global total. The U.S. follows at 17%. Other countries fall far behind this publication level, with India in third place at just 6.4%, and Germany, Japan, the UK and South Korea closely trailing. Given that China contributes just 14-15% of global science publication output across all fields, the 24% figure demonstrates the Chinese focus on achieving net zero. Their net zero publication output has increased almost exponentially since 2012, and surpassed the United States in 2019. In patent development, China also leads by a wide margin, with Japan in second place and the other relevant countries grouped fairly close behind.
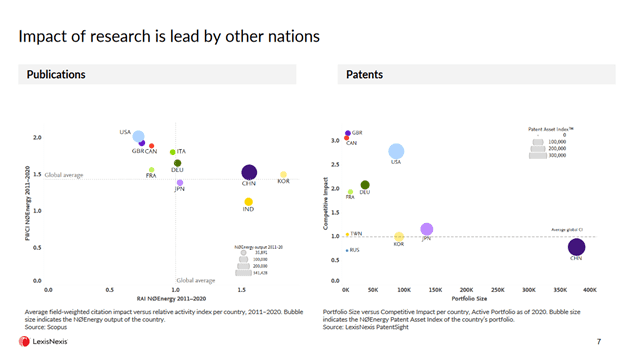
But relative total patent and publication outputs don’t tell the whole story because both vary so widely in quality and impact. The report demonstrates that while China has the largest patent portfolio, the average quality of their patents (measured by relative competitive impact) is below the global average—though China still leads in total aggregate impact due to sheer numbers. Several countries have stronger per-patent quality levels, including Japan and Korea which both possess overall portfolio sizes larger than their Western counterparts. U.S., France, Germany, UK and Canada have smaller portfolios but with higher average quality still.
Relative quality of research publications (measured by citations in other scientific publications) compared between nations follow a similar pattern. China leads in terms of aggregate research quantity and quality, but other countries have a higher mean quality of publication with a smaller total number.
The report also looks at historical trend lines in net zero research, beginning with 2011 for publications and 2001 for patents. We see that China overtook the U.S. in terms of publication portfolio strength in 2012 and has stayed on top since. The relative year-by-year bubble size in the chart measuring publication output levels shows that China has rapidly increased output pace while other countries have maintained fairly stable output levels over the past decade.
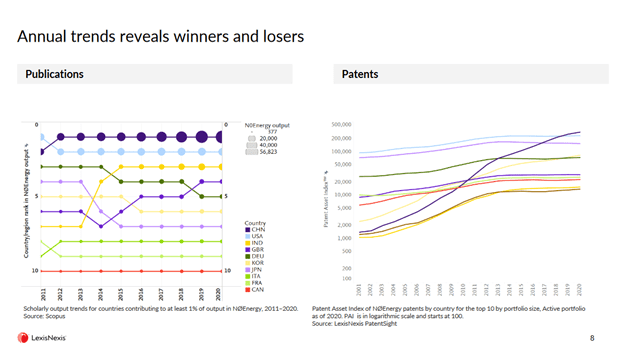
The year-by-year patent levels show the same overall trend, with China rising to the top from near the bottom. South Korea’s trend line is worth noting, as it shows significant progress for the first decade beginning in 2001, and then a leveling off.
Corporate investment and innovation
Moving on from nation-by-nation analysis, which corporations have made the greatest scientific contributions toward net zero? In terms of patents, the report finds that Samsung SDI leads in terms of relevant share of total portfolio, with other corporations making strong showings due to patents related to specific sub-fields. Toyota, for instance, holds a strong patent portfolio due to early innovation in hybrid automotive tech, and Panasonic and Bosch lead in battery-related patents. The State Grid Corporation of China, the major national power utility, continues the pattern of Chinese entities leading in total portfolio size.
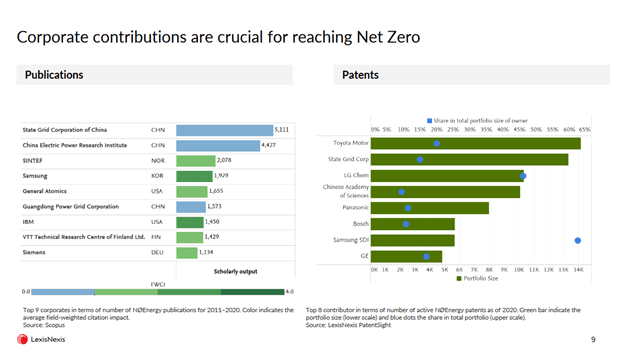
On the publication side, two major Chinese corporations lead in terms of portfolio size, though once again the citation impact of Chinese corporate scientific publication falls behind others such as Samsung (South Korea) and IBM (U.S.). Other corporations internationally play an important role, but there’s room for them to increase their contribution to innovation. An emerging player of note is Finland’s VTT Technical Research Centre.
Net zero relevant scientific fields/technologies
As discussed at the beginning of the webinar, net zero innovation encompasses different technology areas. Which of these sub-fields are growing in importance? Publication levels show a notable increase in bio-energy research with steady growth in other relevant fields, except for nuclear energy research which has kept at a steady output, particularly since 2010. This may be due to political factors—for example, Germany’s policy to phase out nuclear power.
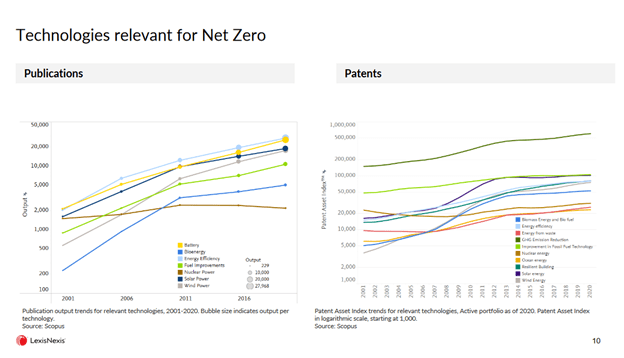
This plateau in nuclear innovation rate is also evident on the patent side. Patent activity for the decade beginning in 2001 showed clear upward trends in research in solar, wind and biomass/biofuel, then a leveling off in the second decade. In the case of solar, this is likely due to the price collapse around 2011 which disincentivized innovation. It’s less clear what caused wind and biofuel energy patents to slow down, beyond perhaps increased interest in other fields. There’s a trade-off between short term and permanent greenhouse gas reductions in terms of which energy sources take research priority, and the net zero mandate has shifted emphasis toward permanent solutions. An important note for this chart is that scientific fields vary in the specificity of definition which creates some ambiguity in these relative positions. Solar and wind energy–related patents, for instance, are both more sharply defined than greenhouse gas emission reduction.
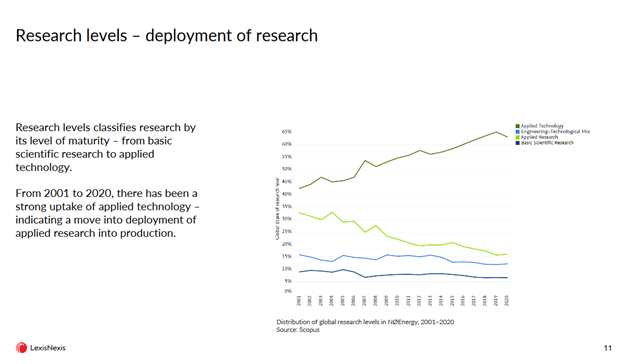
Our report also takes a look at relative activity year by year of progressive research stages ranging from the “blue sky” of basic scientific research to applied technology—the commercial deployment stage of net zero–related products. Not surprisingly, since 2001 we see an overall rise in Applied Technology activity, as research has matured into actual end-use products. Concurrently, Basic Research has declined somewhat as have the intermediate levels of applied research and engineering-technological mix.
Net zero and United Nations Sustainable Development Goals (UN SDGs)
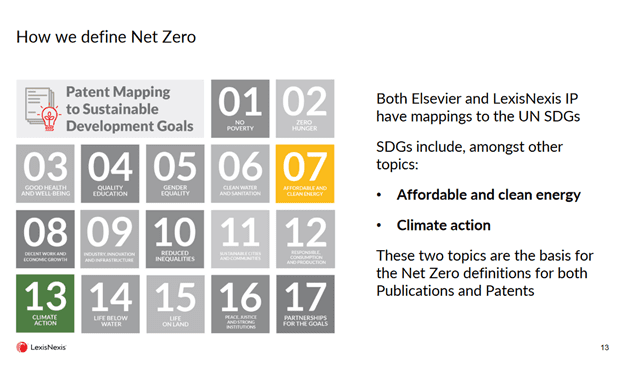
The net zero agenda is a subset of the larger framework of United Nations Sustainable Development Goals, known as UN SDG. The full UN SDG program consists of 17 global targets in areas such as poverty, sustainable cities, and peace and justice, all aimed at improving human welfare. Net zero maps most closely onto two of the UN SDGs—Affordable and Clean Energy, and Climate Action. The report correlates relatively new patent activities to UN SDGs, though some of the 17 target areas aren’t explicitly technological at first order (such as “Decent Work and Economic Growth”).
A host of world organizations, governments and funding institutions have endorsed the UN SDG platform and use it to guide their policies and investment priorities, and the agenda is also a hot topic at the corporate level. Many corporations generate internal reports about their alignment with UN SDG and net zero, and communicate this priority to customers. Research shows that between 70%-80% of both consumers and employees would prefer to engage with sustainable companies, which makes it a central component of corporate strategy. RELX, the parent company of LexisNexis® and Elsevier®, has signed the UN SDG Global Compact as well and maintains an online resource center.
Conclusion
In summary, net zero and UN SDGs are, and will remain, important innovation drivers. This report gives investors and other stakeholders a view of which areas are making the highest level of technological contribution, and which are primed for future growth.
Watch the on-demand webinar How Net Zero Energy Research Translates into Real-World Applications.
Read the report: Pathways to Net Zero: The Impact of Clean Energy Research.

Which Companies Own the Strongest Sustainable Technologies?
In a first-of-its-kind report, learn which companies are the world’s leading patent owners with the potential to drive transformative innovation toward the United Nations Sustainable Development Goals (SDGs).

Want insights into how sustainably focused you and your competitors are?
Conduct objective patent analyses against the United Nations Sustainable Development Goals (UN SDGs) using LexisNexis® PatentSight®.
