Value-Driven Innovation Management – A closer look at the Top players

Carsten Guderian
May 13, 2020
This is the second post in our recently introduced blog series on technology intelligence, where we concentrate on technology-focused competitive intelligence sources, derived from patent analytics. We discuss how scientifically developed patent quality indicators can be used to accurately evaluate innovation efforts and compare innovators in a field from a qualitative perspective. In the previous post, we looked at the technology field of “smart homes” to form a bird’s eye view of the development of patents in this technology over the years. In this entry, we look at individual players in this field and compare the performance of their portfolios against each other. Like this, throughout this series, we used LexisNexis® PatentSight® to analyze the patents that were filed in the ‘smart-homes’ technology and various other technologies, we explain how patent quality is discernibly present, relevant and important for strategic decision-making. Read on to find out how moving away from a volume-based approach towards value-driven innovation management can help you increase business and organizational value.
In the first part of our blog series on technology intelligence, we discussed a technological landscaping chart based on a definition of the technology field “smart homes”, which EconSight GmbH, a swiss-based technology consulting firm, had defined. This primary analysis, focused on the development of the overall portfolio of patents in this field and the portfolio’s Patent Asset Index, over time. We discovered that, countering common views, some patents that can be attributed to this technology already existed 20 years ago. However, we also inferred that there has been substantial growth in this technology with annual single- or double-digit growth in both the key performance indicators (KPIs).
Click here if you would like to read part 1 of this blog series.
Technology intelligence at the industry-level: patents in “smart homes”
While the first technology-field or industry level analysis described in our previous analysis provides us with information that there has been increasing R&D activity and continued growth in firms’ patent portfolio strengths in this field – deeming it interesting for innovation managers considering “smart homes” as a promising technology field – the results did not allow us to form an opinion about the most important firms innovating in this technology space. Zooming in from an industry to a corporate level analysis, we obtain insights on the firms that are the strongest innovators.
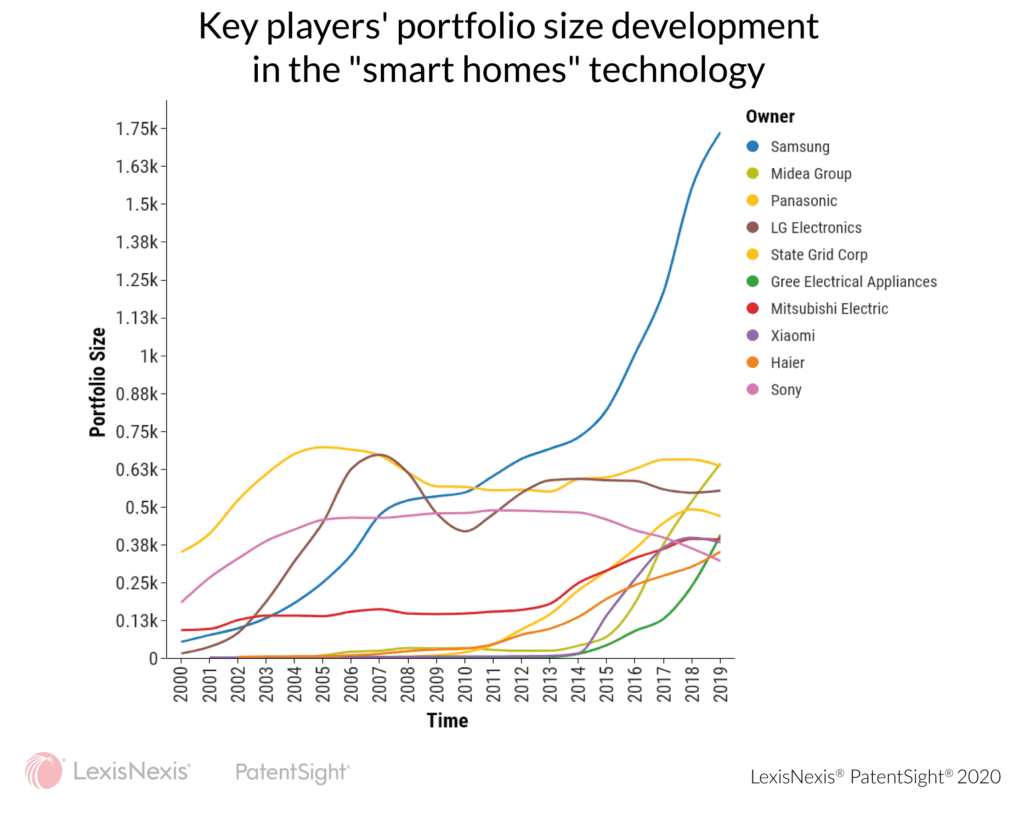
Portfolio size trends of individual players

The above chart, developed using quantity-driven patent data, displays the ten companies with the largest number of patents, or patent families to be precise, in “smart homes” on December 31, 2019. For these ten firms, the overall growth rates from 2000 to 2019 vary between 73.37% for Sony to 32,050% for Midea Group. These are astonishing growth rates, but not surprising, given that most of these firms held few to no patents in 2000, resulting in such tremendous growth rates with a fractional increase. In fact, Xiamoi had its first “smart homes” patents in 2001, Midea Group and Haier entered the space in 2002, whilst State Grid Corp had their first “smart homes” patents in 2004 and Gree Electrical Appliances only in 2006. In 2000, the only companies out of the top 10 to own more than 100 patents in this technology were, Sony with 184 and Panasonic with 350. In terms of annual growth, no real universal or consistent trend is detected. While Haier experienced continuous double-digit growth rates with the exception of 2005, and Samsung experienced relatively stable double-digit annual growth rates that only dropped to single-digit growth rates in 2009, ’10 and again from 2012-14, other firms were subject to more fluctuations. LG’s portfolio, for example, grew from 2001 to 2007 and 2011 to 2014 – with single-, double- and in the early years even three-digit annual growth rates, but also declined in the remaining years, for example in 2009 by 21.64 percent. It is interesting to note that for firms with fluctuating positive and negative growth rates, crowding out effects occur, which also affect the overall growth rates mentioned above.
Learn more about PatentSight and the Patent Asset Index.
Excellent data quality is the foundation of reliable analyses. Learn how PatentSight enhances patent data here.
For more on innovation management and technology intelligence read Value-Driven Innovation and Intellectual Property Management.
About the author: Carsten Guderian
Carsten is a Senior Project Leader and has a background in Economics and Business Administration, particularly innovation management and patent analytics. He has been affiliated with PatentSight since 2012.
