5 Ways To Enhance Patent Strategy With Data Analytics

By Eric Snustad
Originally published on Law360.com
Not long ago, the primary manner in which patent practitioners would obtain information about a particular examiner’s working style was to actually interview or otherwise work with the examiner, hear reports of colleagues’ experiences with the examiner, or both. Since that not-toodistant past, there has been a bloom of data analytics tools for patent practice. Some new features of these tools can profoundly enhance patent strategy with data analytics.
Here are five examples of how applicants and their attorneys can enhance patent strategy with data analytics tools:
1. Identifying types of inventions on which to file applications aggressively or passively
Historically, it was challenging for patent practitioners to predict how difficult or efficient prosecution would be for a particular type of invention. Today, the situation is different. Data analytics systems make it possible for practitioners to predict which types of inventions are likely to be handled by more difficult or more favorable tech center groups.
With current data analytics technology, practitioners can enter claim language for a proposed patent application and get a report on which tech center groups are most likely to handle the application. I recently entered an independent claim of a hypothetical mechanical invention. Two tech center groups were shown as the most likely to be assigned. The first tech center group, which was shown to have the greatest likelihood of handling the case, has an average allowance rate of about 74%. In contrast, the next most likely tech center group has an average allowance rate of about 57%. In more extreme cases, the disparity may be even greater.
One system categorizes examiners as “red,” “yellow” or “green.” The color helps predict the length of prosecution with a given examiner. When the most likely tech center groups are predicted, the chances of receiving a green, yellow or red examiner are shown. In fact, data are provided on both: (1) the actual number of each examiner type in the tech center group, and (2) the overall likelihood of receiving an examiner of each type in the tech center group.
The percentages for these two statistics are often different. For example, green examiners tend to dispose of cases more swiftly than yellow and red examiners. Green examiners therefore tend to be assigned more cases, and this can increase an applicant’s chances of being assigned a green examiner above the simple percentage of green examiners in the tech center group.


In the hypothetical example above, for the first tech center group, the likelihood of receiving a “green” examiner is about 69%, whereas for the second tech center group, that likelihood is only about 26%. As most practitioners and applicants know, the particular examiner assigned to handle an application can profoundly impact the outcome, duration and cost of prosecution.
With the information available from the latest data analytics tools, practitioners can work with applicants on a more educated basis to enhance patent strategy whereby applications are filed more aggressively for inventions likely to be handled by more favorable tech center groups, while filing more passively on inventions likely to be handled by more difficult tech center groups. When it is important to succeed in building a portfolio, a well-founded strategy of this nature can pay dividends. And it can be of critical importance when competitors are filing their own applications in the same technology areas.
2. Determining how best to draft claims to steer toward or away from certain tech center groups
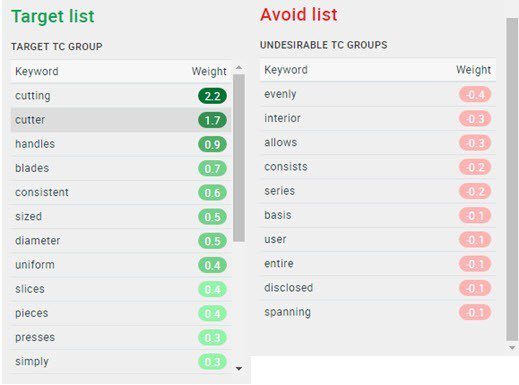
In situations like the hypothetical example above, one tech center group may look more favorable than another. It may thus be preferable to have your application assigned to, and examined by, the more favorable tech center group. In such cases, using data analytics can enhance patent strategy to identify claim terms that may trigger, or even deter, assignment to one tech center group versus another. The practitioner can thus consider claim language adjustments that make it more likely the invention will be assigned to a tech center group that is statistically favorable.

Practitioners will appreciate that there are critical limits on one’s ability to change the wording of a claim with the goal of having the application handled by a certain tech center group (or to avoid a certain tech center group). Naturally, claim quality should not suffer for want of a particular tech center group. In some cases, however, there may be sufficient latitude to draft claims that satisfy both goals. While this is an intensely case-by-case matter, the ability to compare likely landing spots in the U.S. Patent and Trademark Office, and to consider proactively adjusting one’s claims based on such information, should not be overlooked.
3. Enhance patent strategy by coupling data analytics with examiner interviews
Even with the newest data analytics tools, it remains difficult to predict with certainty which particular examiner will be assigned to handle a given application. Data analytics, however, provide a start down this road, and in some cases, an active examiner interviewing program can fill in some blanks.
For those who regularly conduct examiner interviews, one of the benefits is gaining an even more comprehensive understanding of which examiners are particularly difficult, which are particularly reasonable and how different examiners operate. With enough experience working with individual examiners, it becomes possible to develop an even more focused strategy on which types of inventions applications should be filed aggressively or passively. In special circumstances, this knowledge can enable the practitioner to predict, albeit with less than guaranteed accuracy, which exact examiner is likely to handle a patent application contemplated for a particular invention.
Using the knowledge gained from enough firsthand examiner experience, it has been possible to help clients develop an even more detailed filing strategy under which applications are filed aggressively on certain types of inventions and passively on other types of inventions. This can be beneficial in helping applicants maximize the strength of their portfolios while also spending their patent budgets wisely.
4. Determining prosecution strategy based on the particular examiner assigned
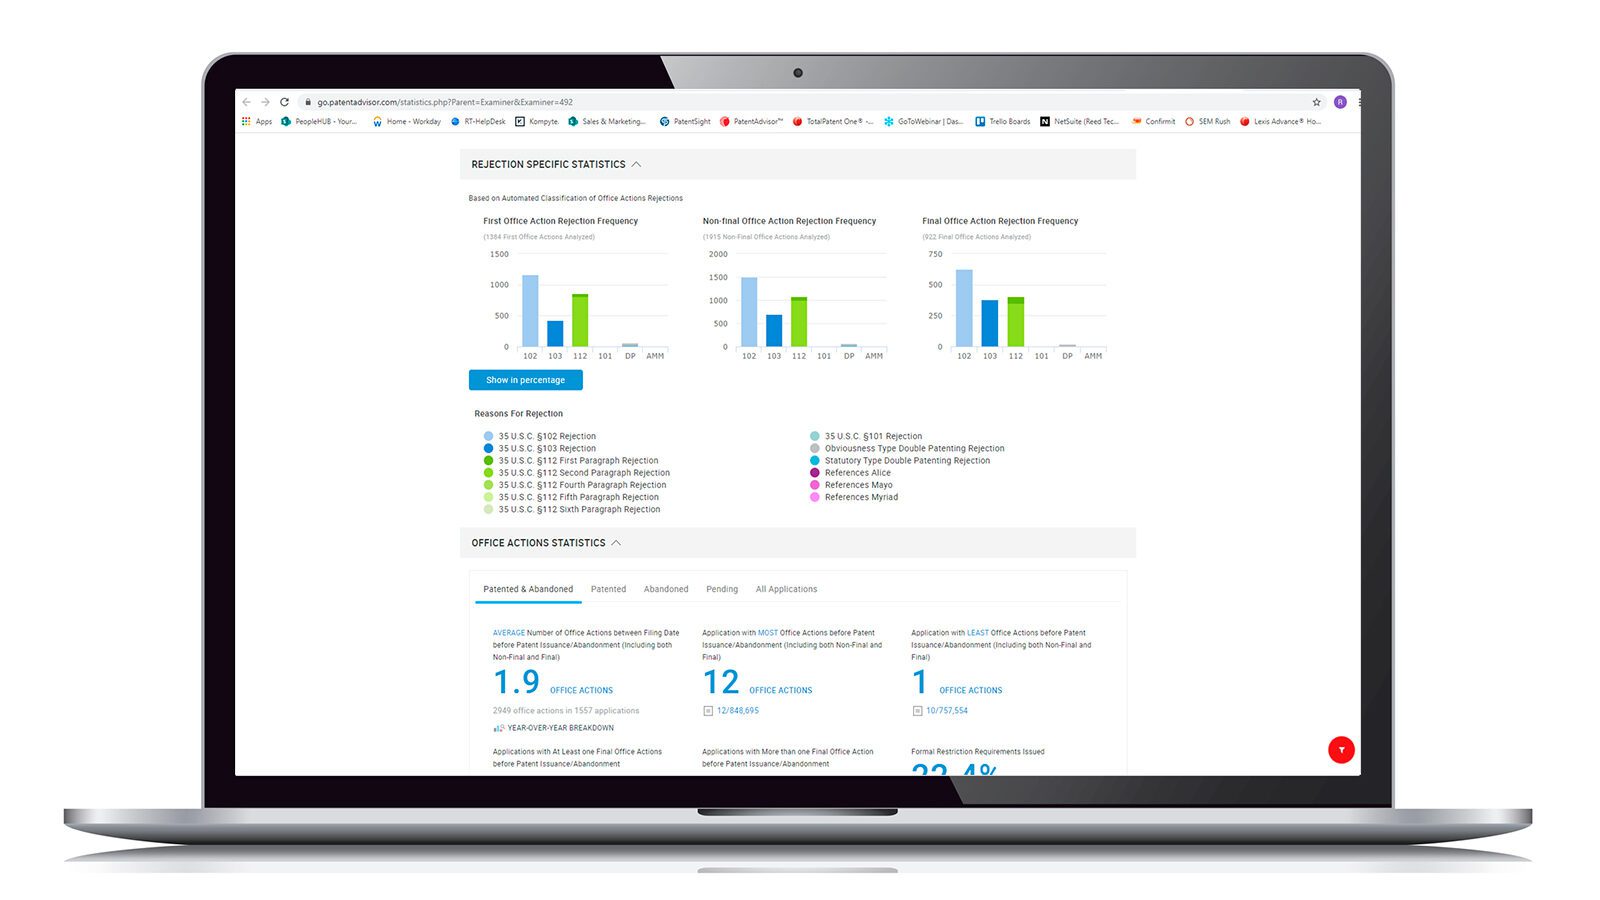
Once a particular examiner is assigned to handle your application, enhancing patent strategy with data analytics tools make it possible to assess numerous facets of the examiner’s behavior. The first thing checked is often the examiner’s allowance rate. That, however, merely scratches the surface of what is possible with the latest tools.
As noted above, examiner interviews can be a powerful prosecution tool, particularly when coupled with data analytics. Certain examiners, however, are statistically more likely than others to allow cases after an interview. With data analytics, it is possible to see examiner-specific data on how frequently the next significant event after an interview was an allowance versus abandonment, a request for continued examination, a final office action or a nonfinal office action. While the data show interviews to be efficient for many examiners, some examiners are considerably more likely than others to allow cases after an interview. Thus, it can be helpful to consider an examiner’s interview statistics.

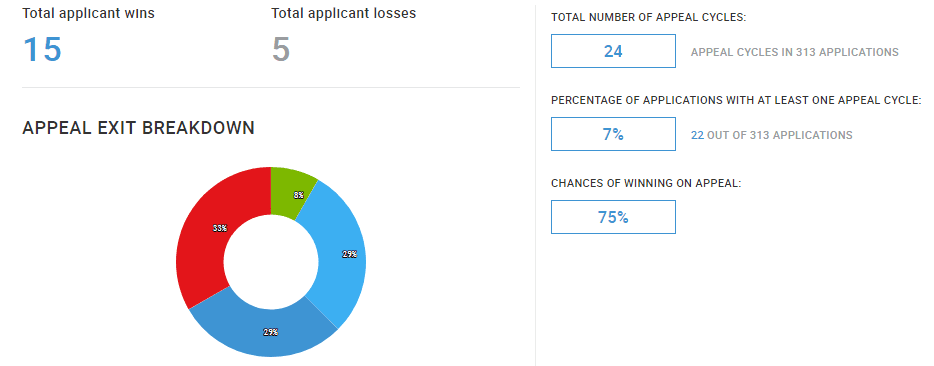
It can also be helpful to consider an examiner’s appeal statistics. Data analytics can show the likelihood of winning an appeal when a given examiner handles prosecution. Furthermore, at least one system provides a breakdown of how frequently particular outcomes occur at different stages of appeal. Needless to say, the likelihood of winning on appeal varies significantly from one examiner to another.

5. Using examiner data in monitoring competitors’ patent filings
Many practitioners monitor the patent activities of their clients’ competitors. It has always been difficult to predict with certainty the likelihood of a competitor’s claims being allowed or the exact scope of any patent that may result. With current data analytics tools, however, practitioners can benefit from having more information when assessing the potential outcomes. As noted above, it is possible not only to check the allowance rate and average prosecution length of a particular examiner handling a competitor’s application, but it is also possible to assess that examiner’s statistics after an interview and after an appeal. Couple this with knowing the prosecution tendencies of your competitors, and the ability to assess the patent activities of competitors has evolved significantly.
LexisNexis PatentAdvisor® was used in the examples given above. Various other systems may provide similar data.

Need more predictability in the patent prosecution process?
Learn how to develop successful IP strategies and proficiently manage patent applications throughout the entire prosecution process using data-driven insights and advanced analytics.
