Tools for Finding Favorable Patent Examiners

In the early days of patent data analytics, patent professionals relied upon career statistics to size up the USPTO patent examiners they faced. Unfortunately, patent metrics based on career averages are unforgiving to patent examiners that develop and grow throughout their careers (including popular metrics like patent allowance rates and the number of office actions issued per application). The average allowance rate of a once-difficult-now-friendly patent examiner, for example, might look somewhat average. Career averages are not always accurate reflections of a patent examiner’s contemporary behaviors. To address this issue, a patent metric was introduced on the LexisNexis PatentAdvisor® patent analytics platform to predict examiner behaviors more accurately. It also happens to help get patent applications assigned to favorable patent examiners.
How PatentAdvisor ETA™ changed the game
Not just a black-and-white career calculation, the PatentAdvisor ETA (Examiner Time Allocation) metric is based on a proprietary algorithm that addresses many of the issues that accompany career statistics. Blended into each patent examiner’s ETA value is the examiner’s experience level, their recent behavioral trends, and does not penalize examiners for actions taken by patent applicants (such as voluntary abandonments). Based on their values, examiners are categorized as red (most difficult), yellow (moderate difficulty) or green (least difficult), and the color-coded PatentAdvisor ETA is an informative way to predict examiner behavior.
Since the ETA metric was introduced, patent professionals have used it in various ways. Once a USPTO patent examiner is assigned to their patent application, patent professionals can use the examiner’s ETA value to predict how “smooth” or “choppy” prosecution is likely to proceed. This can help manage client expectations regarding cost and duration and help patent practitioners decide how to best interact with their patent examiner for the best results.

How PatentAdvisor ETA can help find favorable patent examiners
Unknown to many patent practitioners is that PatentAdvisor ETA values can be leveraged to evaluate entire art units of patent examiners and inform drafting decisions before they submit their patent applications to the patent office. As a data and analytics division of LexisNexis, LexisNexis® Intellectual Property had to investigate how “green,” “yellow” and “red” examiners are dispersed among the many groups of patent examiners defined by the U.S. patent office. As a result, PatentAdvisor™ provides users with the distribution visualization, which essentially shows the exact number of each type of examiner in any USPTO art unit or technology center. Peculiarly, however, USPTO patent data has revealed that in a given art unit comprised of 50% “red” patent examiners and 50% “green” patent examiners, the next patent application assigned to that art unit is more likely to end up on the desk of a “green” patent examiner.
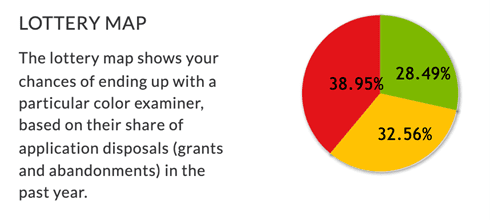
Why is there not an equal likelihood that the application would be assigned to either a red or green patent examiner? Simply put, cases involving green patent examiners resolve more quickly compared to red examiners that tend to issue more office actions. Yellow patent examiners fall somewhere between green and red examiners.

To address this issue, the PatentAdvisor tool also provides a lottery map visual representation that more accurately communicates the likelihood of being assigned to a specific type of examiner in a given examiner group. With the lottery map, users can identify the “friendliest” USPTO art units that might be assigned to their application. They can then modify the language they use in the patent application to improve the odds of it being assigned to a favorable art unit and favorable patent examiners.
From patent examiner career statistics to more sophisticated patent metrics, LexisNexis® Intellectual Property continually strives to develop superior patent products. With access to patent examiner time allocations and visualizations like the distribution and lottery map, users can positively influence the patent process before filing and devise informed prosecution strategies for better outcomes.
Learn more about PatentAdvisor and PatentAdvisor ETA.
Discover how to use patent data to understand USPTO examiners.
For more on how to find favorable patent examiners watch the on-demand webinar Patent Prosecution Analytics: No Longer Just a Nice to Have and read the overview here.

Need more predictability in the patent prosecution process?
Learn how to develop successful IP strategies and proficiently manage patent applications throughout the entire prosecution process using data-driven insights and advanced analytics.
