Benchmarking Competitors in Complex Technology Landscapes

– A Generative AI Case Study –
Technology is becoming increasingly overlapping and complicated. As it develops further, the landscape is only expected to get even more convoluted. Every product borrows from multiple technical innovations to perform complicated tasks. Benchmarking competitors’ activities in both your own and related technologies is essential for companies to stay competitive. As forward-looking instruments that offer a view into the future of technologies, patents provide crucial insights into global innovation strategies.
This blog explores how to analyze complex technology landscapes, using Generative AI as an example, to identify the top players and their strategies. Advanced patent analytics tools like LexisNexis PatentSight+ include sophisticated custom technology taxonomy capabilities. This enables the evaluation of the quality and strategic positioning of specific technology portfolios. For decision makers looking to stay ahead in generative AI technologies, such an analysis provides incredible insights into innovation strategies.
Benchmarking competitors in Gen AI – patent portfolio trends
We used LexisNexis Classification powered by Cipher to identify a set of Generative AI-related patents. We analyzed these patents with PatentSight+ to create visualizations and simplify the complex landscape, highlighting its key players.
To benchmark competitors in the Gen AI space, we first examine a simple Patent Asset Index chart. The Patent Asset Index is a scientifically validated metric that considers patent citations and geographic coverage to determine value. In Figure 1, the bar chart on the left reveals that Alphabet, which owns a considerably smaller portfolio, has the strongest innovation in Gen AI technology, as defined in our search. Baidu, Microsoft, Adobe and Tencent trail close behind in overall portfolio quality as measured by the Patent Asset Index.
The pie chart on the right shows a different view of the technology space. In terms of portfolio quality, the top 10 companies dominate only about a quarter of the space. This suggests that a disruptor from the “Others” group could potentially revolutionize this young space.
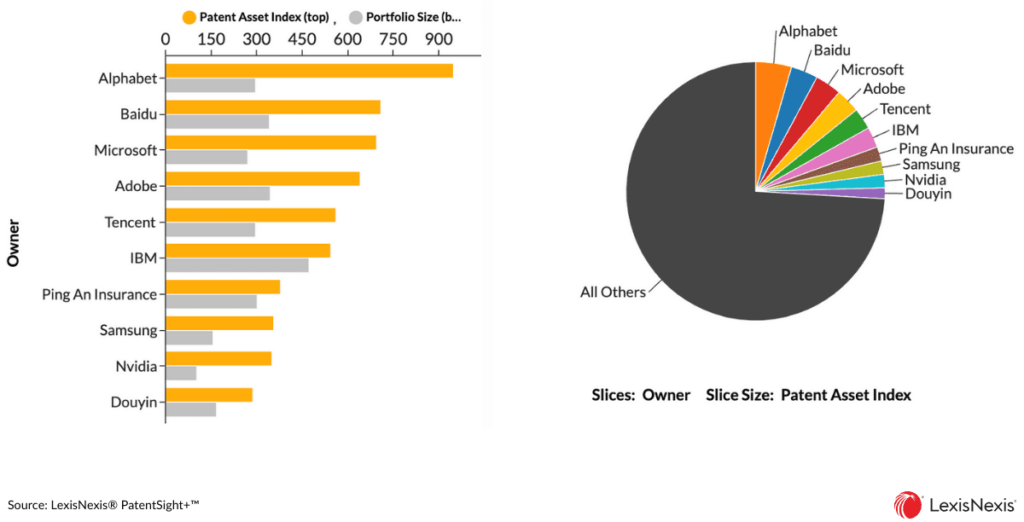
Figure 1: Top 10 companies in Gen AI ranked according to portfolio quality measured by Patent Asset Index.
Qualitative analyses of Generative AI patent portfolios reveal top players
Merging a bespoke classification system with a powerful analytics platform like PatentSight+ enables us to generate highly detailed analyses. AI-powered classification of similar patents allows users to perform landscape-level analyses without being confined to a top ten list of companies. This broad perspective is crucial for identifying potential disruptors and understanding the entire competitive landscape, including smaller organizations that may hold high-quality patents.
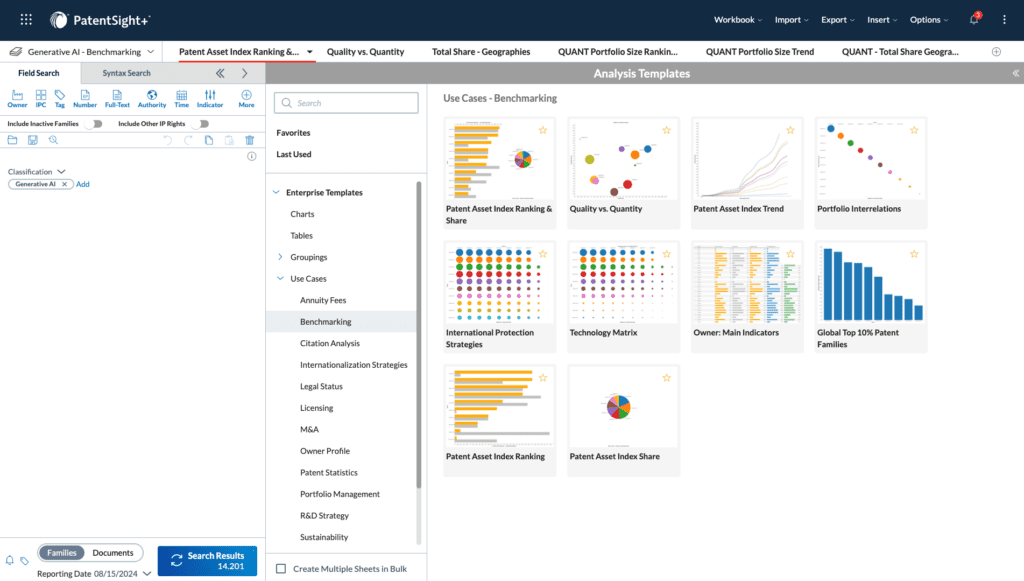
Figure 2: Visualization options available in PatentSight+.
PatentSight+ stands out among other IP analytics tools, offering multiple options to slice and dice patent data. For instance, the Quality vs. Quantity chart (seen in Figure 3) shows us how the top companies compare against each other in terms of overall portfolio strength or quality as measured by the Patent Asset Index. Alphabet’s position as the leader in Figure 1 becomes clear here, as we can see from its position higher up in the chart indicating a higher Competitive Impact, a measure of the relative business value of each patent family.
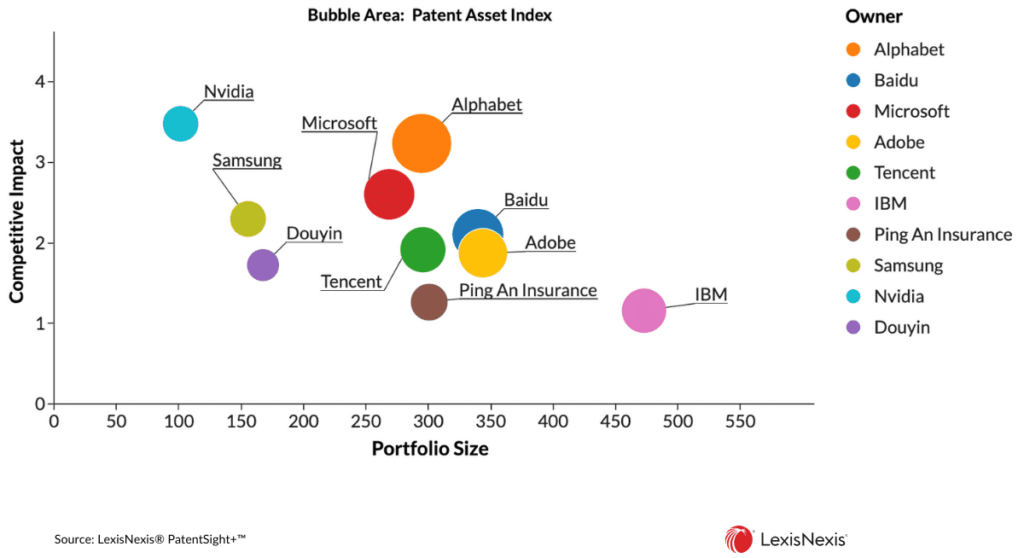
Figure 3: Patent portfolio quality vs. quantity plot comparing the top ten patent owners in Generative AI.
Benchmarking competitors using a quantitative view shows a similar picture
In addition to a qualitative overview, for skeptics of quality metrics that rely on traditional portfolio size analyses, we recreated the chart from Figure 1 with Portfolio Size as the indicator instead of the Patent Asset Index. And so, in Figure 4, we can see a rather noticeable rearrangement of companies in the ranking order. The leader of the pack in this view is clearly IBM, and most notably, the Nvidia portfolio disappears in this view. While it does provide an alternative view, our recommendation is to supplement quantitative analyses with qualitative analyses to reveal the true leaders in a technology area.
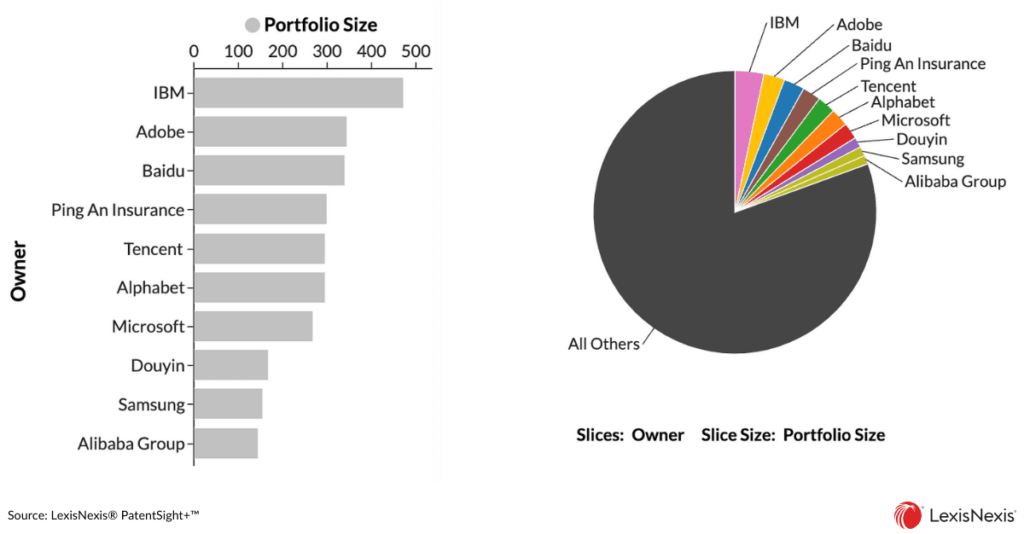
Figure 4: Top 10 companies in the Generative AI technology space ranked according to their Portfolio Size.
We then looked at the trends in this space regarding portfolio size growth over the years. The chart in Figure 5 indicates that this technology is still in its growth phase and how quickly the number of published patents shot up in just the past 5-6 years.
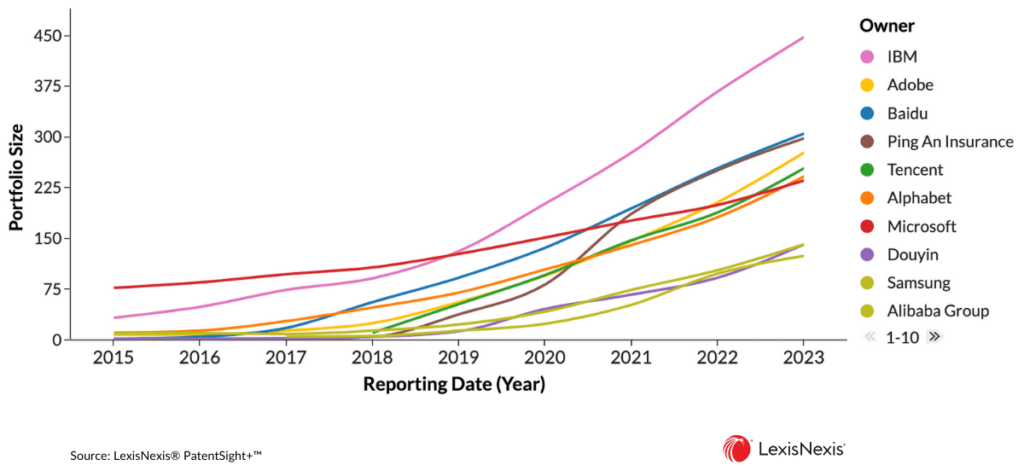
Figure 5: Portfolio size trends of the top 10 patent owners in the Generative AI space.
International patenting strategies in Generative AI
Another insightful chart in the PatentSight+ arsenal of analytics is the International Protection Strategies matrix, seen in Figure 6, which shows the effective share of an active portfolio in each patented region. In the Generative AI example, we can see some emerging patterns of international patenting strategies. While some companies, like IBM, Adobe or Baidu focus more on filing in their home regions. There are others like Microsoft and Alphabet that seem to have a more diverse filing strategy, with considerably more portfions of their portfolios protected outside of the US.
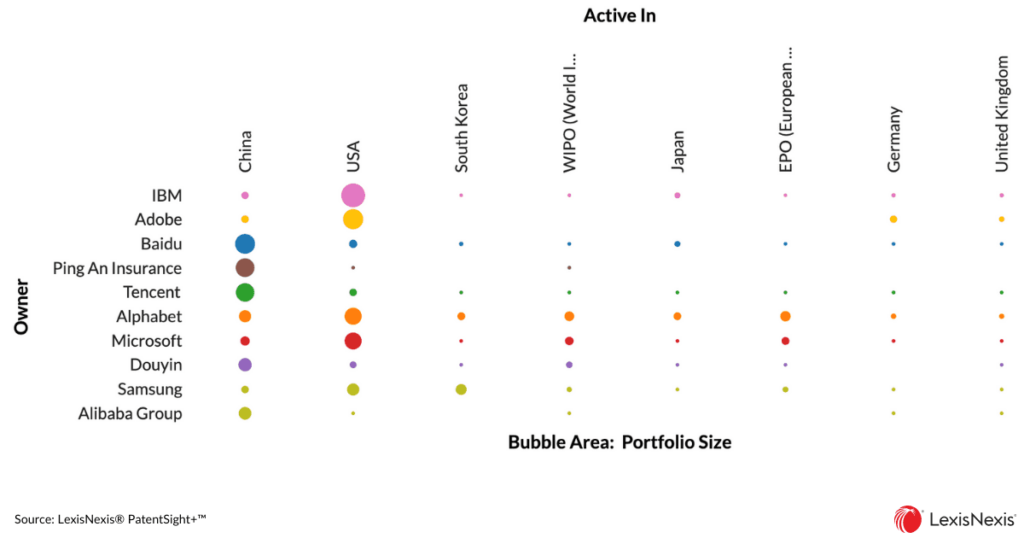
Figure 6: Share of Patent Asset Index of top companies protected across different regions.
The future of Generative AI and AI-powered patent analytics
All trends suggest that Gen AI technology is trending up now, as confirmed by the insights from advanced patent analytics presented in this blog. Just as it impacted major technologies, the integration of AI-powered patent classification and advanced analytics tools like PatentSight+ will revolutionize the way businesses understand and navigate complex technologies.
By focusing on portfolio quality and using customizable, granular insights, technology companies can now use reliable patent data and analytics to stay competitive, innovate effectively, and make strategic decisions with confidence.
Do you want to take a similar deep dive into a different technology field? Schedule a call with our team to learn how to create a personalized report on a technology you define.
